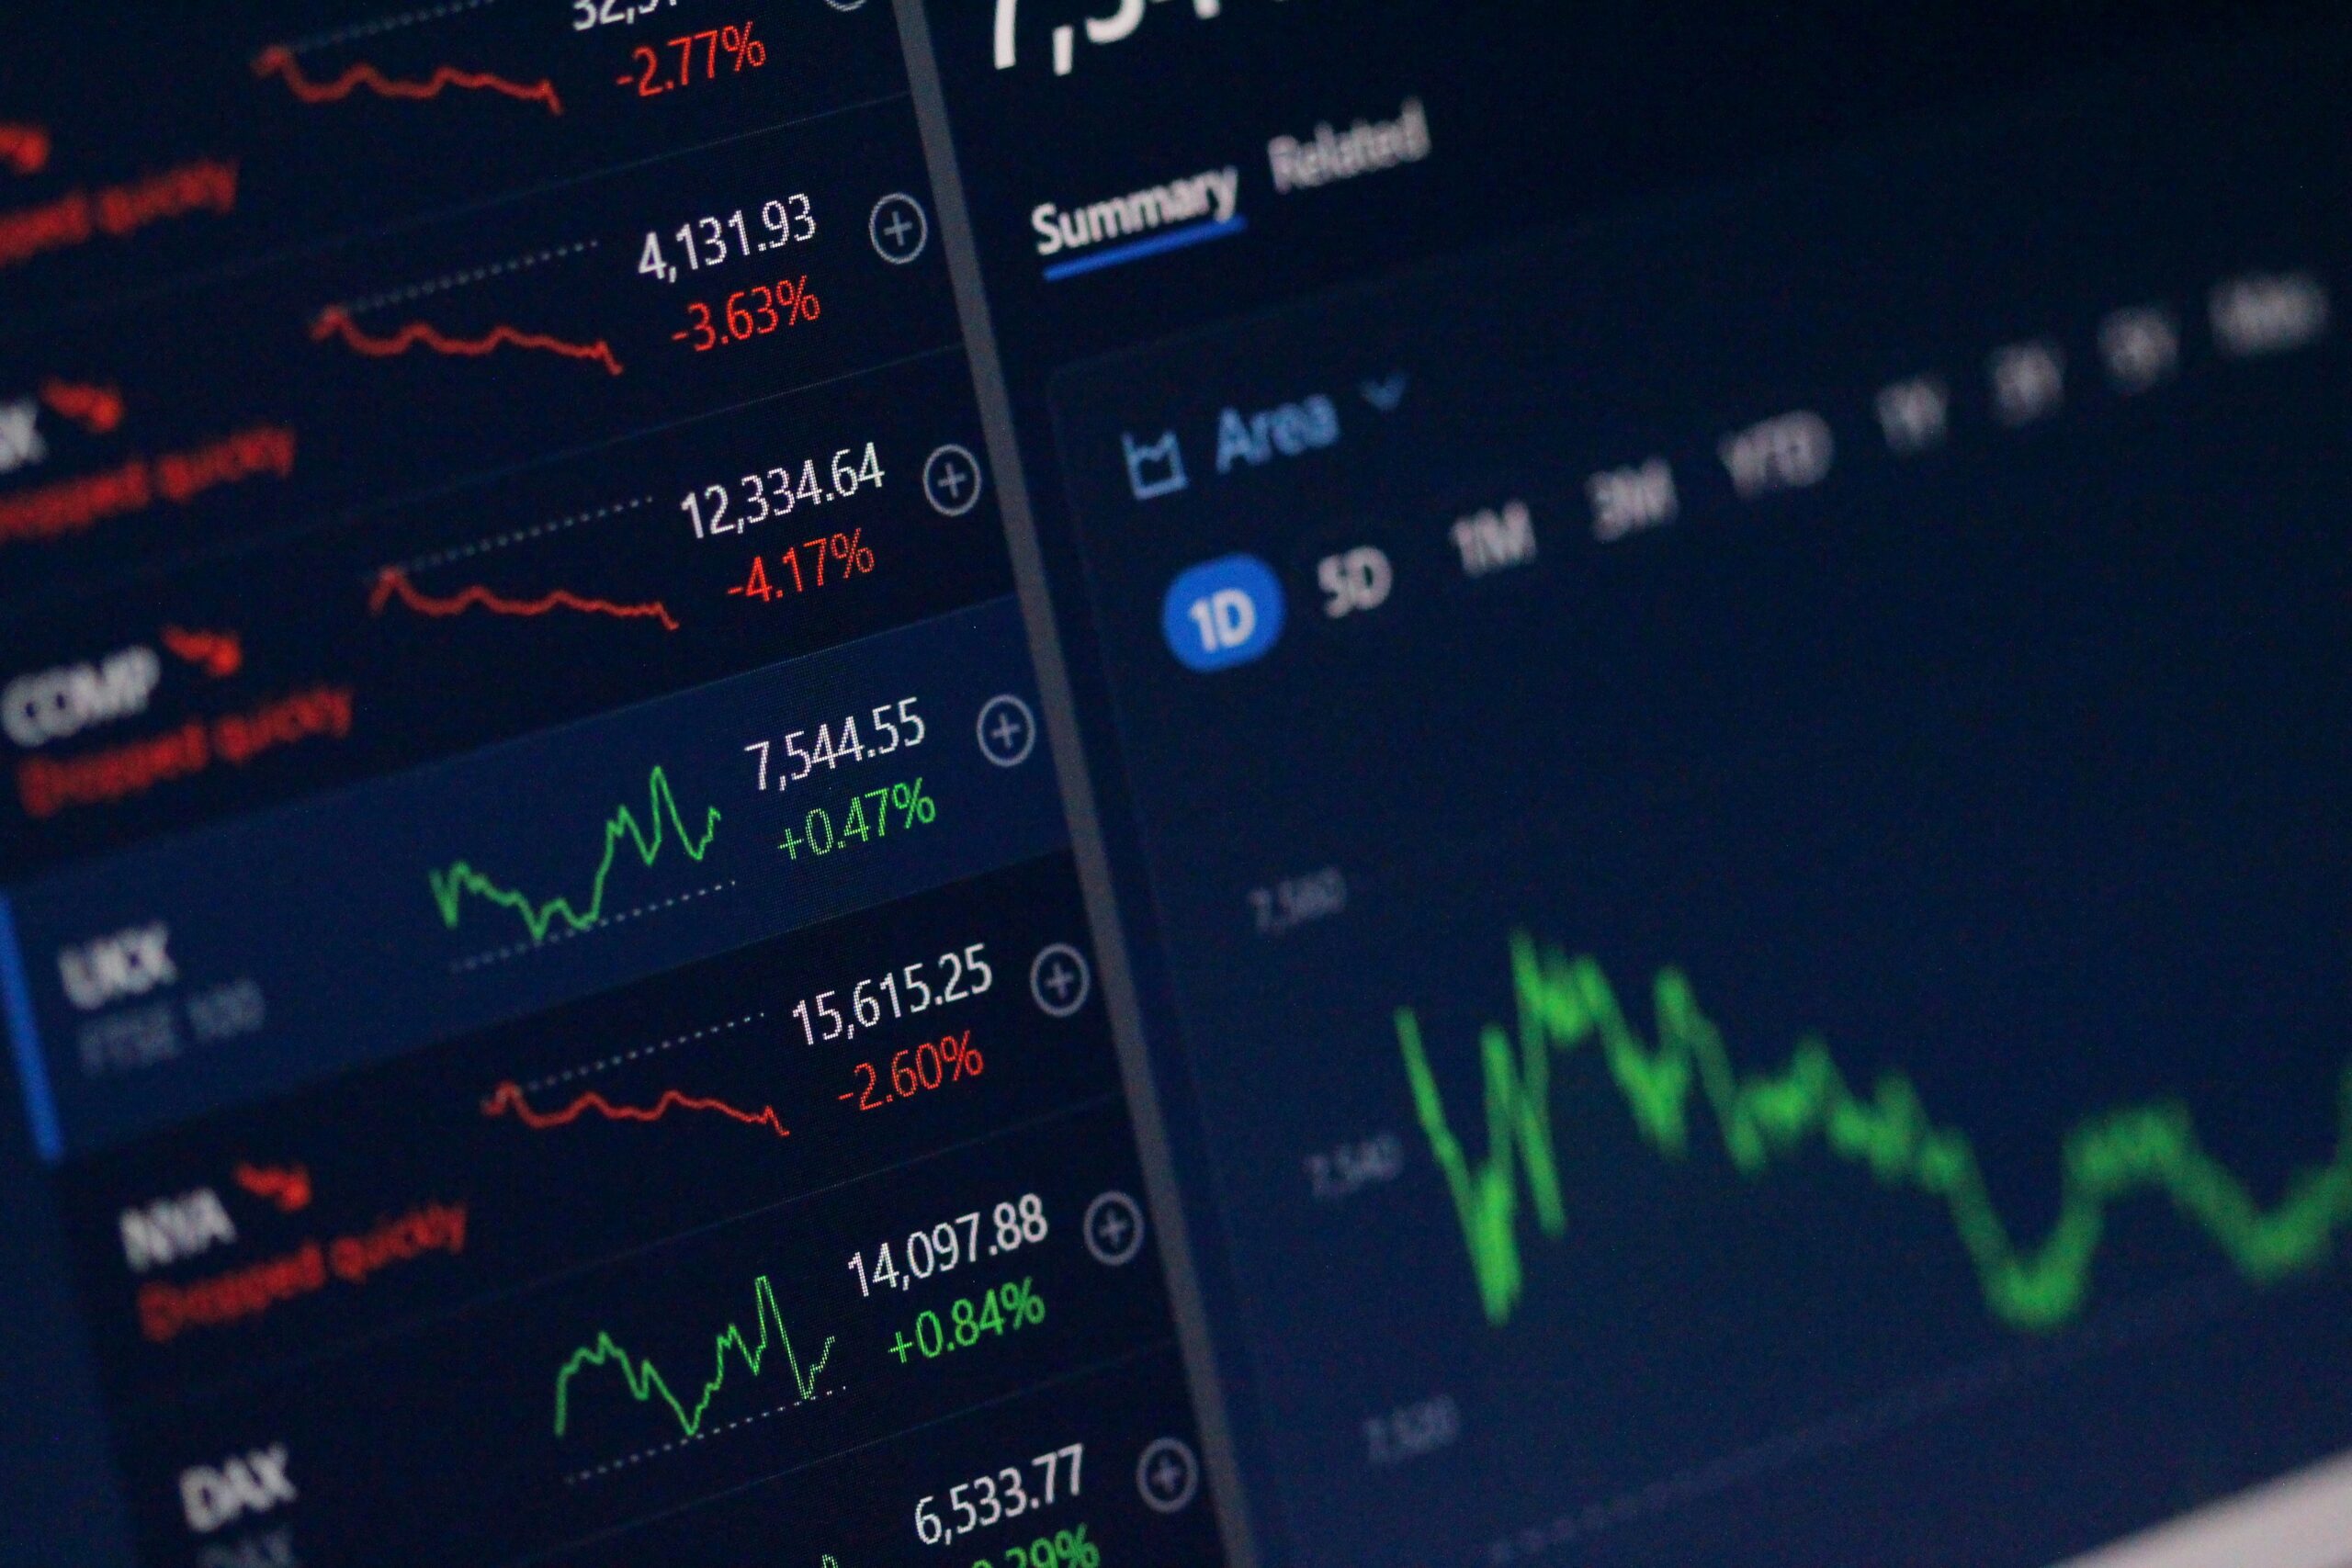
The BSE Sensex option chain is an invaluable resource for options trading in India. It provides insight to both novice investors and those with years of experience. By studying the BSE Sensex option chain you can identify crucial strike prices, support and resistance levels, market positioning, and implied volatility.
As options trading gains popularity among BSE Sensex traders, people tend to rely on the option chain to know where the probability of price discovery could be rather than studying technical charts blindly.
In this article, I will explain what the BSE Sensex option chain is in simple terms as well as more advanced concepts professional traders use.
BSE Sensex Option Chain – Beginner’s Guide
The option chain is a table that shows information about all available call and put options for the BSE Sensex strike prices. Instead of showing just the price of the options, it gives a comprehensive view of the options market by listing important information such as
• Strike prices
• Call option premium
• Put option premium
• Open Interest (OI)
• Change in Open Interest
• Volume
• Bid and Ask
• Implied Volatility (IV)
By reviewing this information, options traders can identify support, resistance, and other key levels.
While technical charts show where the market has been, option chains show where traders expect it to go.
How does it work?
The option chain basically has an entire list of options contracts for each strike price. The middle part of the table displays strike prices while the left side lists Call (CE) options and the right side lists Put (PE) options. A simple option chain layout would look something like this.
Call OptionsStrike PricePut
OptionsPremium80,000PremiumOI80,100OIVolume80,200Volume
As you can see in the example above, each strike price has Call and Put options. The far left side of the table lists the call option premium for each strike while the far right side lists the put option premium. Then on the next set of columns, you can view open interest, change in open interest, and volume for each strike price. Finally, the bid, ask, and implied volatility (IV) are listed.
Key Concepts to Learn
Strike Price
A strike price is a specific price at which an option buyer can exercise their option to buy (call option) or sell (put option) the underlying asset.
Let’s say for example that the Sensex is at 80,250 points. If you are long a call option with a strike price of 80,300, then you have a call option with a strike of 80,300.Identify the current price of the underlying asset
Call Option
A call option is a financial instrument that lets you buy the underlying asset at a specific strike price if you want to. Call options are exercised when the price of the underlying asset rises above the strike price.
Put Option
A put option is a financial instrument that lets you sell the underlying asset at a specific strike price if you want to. Put options are exercised when the price of the underlying asset drops below the strike price.
Option Premium
An option premium is the amount you pay for an options contract. The higher the premium, the more expensive the option is. Option premiums change constantly depending on factors such as time, supply-demand relations, volatility, and the movement of the underlying asset (Sensex).
Open Interest (OI)
Open interest is the total number of outstanding option contracts for a given strike price. High open interest means there is heavy participation in that particular strike. It also indicates liquidity and possible support and resistance levels.
Professional traders tend to keep a close eye on the change in open interest to read the market accurately. If open interest increases throughout the day, it means more traders are entering the market. Likewise, if open interest decreases throughout the day, it means more traders are exiting the market.
Implied Volatility (IV)
Implied volatility represents an options contract’s expected future volatility. The higher the number, the more volatile the underlying price is expected to be. Higher numbers also indicate more expensive options while lower numbers indicate cheaper options.
Traders who want a deeper understanding of implied volatility in options trading can benefit from reviewing educational resources before applying it to real market analysis.
Reading the Option Chain – Detailed Guide
You can think of the option chain as a multi-variable chart that requires you to review several data points to understand where the market is headed. Here are the key things to look for when studying the option chain.
1. Identify the current price of the underlying asset
The first thing you need to do when studying the option chain is to know the current price of the underlying asset. For example, if Sensex is at 80,250, strike prices around that area are known as At-The-Money strikes (ATM).

2. Look for unusual levels of Open Interest (OI)
Unusually high levels of open interest (OI) suggest strong demand among put or call options. When it comes to options, heavy call OI suggests resistance while heavy put OI suggests support.
Using the example above, if Sensex is at 80,250, we can look at the option chain to find any unusual levels of put or call open interest.
StrikeCall OIPut OI80,200LargeSmall80,300Very LargeMedium80,400LargestLow
Based on the example above, you can assume that sellers are expecting a tough time moving the market beyond 80,400 given the very large call open interest at that level.
3. Look for changes in Open Interest (OI)
New traders often forget that open interest (OI) levels change constantly throughout the day. Markets are dynamic, and so are positions held by traders. If you see extremely large levels of call open interest at a certain strike price, you should always ask yourself, “is this strike price still popular among traders?”
It is always a good idea to analyze the option chain with changing open interest in mind. For example, look for the following patterns:
• Rising price + Rising call OI
• Falling price + Rising put OI
• Stable price + Falling OI
These are just a few examples. If you study the option chain more closely, you will certainly be able to find more interesting patterns.
4. Look for a balance between put and call options
A balanced options market has roughly the same level of put and call open interest as well as trading volume. A balanced market favors neither bulls nor bears so it makes sense to take your time when entering a trade.
On the other hand, an imbalance suggests favorable conditions for either bulls or bears depending on put or call options dominating the market.
5. Look at the implied volatility
High-implied volatility numbers tend to show up before major events such as
• RBI’s policy decision
• Elections
• Corporate results
• Key macroeconomic data releases
During periods of high volatility, options tend to be more expensive. With that said, don’t fall for the trap of chasing low implied volatility numbers hoping that prices will soon drop only for them to shoot right back up.
Putting it All Together – Using an Example
Let’s assume that the Sensex is trading at 80,100 points. The option chain looks like this.
StrikeCall OIPut OI80,000LowVery High80,100MediumHigh80,200HighMedium80,300Very HighLow
Based on the information above, here is what we can gather.
• Strong support around the 80,000 strike price
• Strong resistance around the 80,300 strike
• Sensex is likely to consolidate between 80,000-80,300
Now, keep in mind that this information does not guarantee what will happen next but it does tell you what most traders expect to happen.
Advanced Concepts and Pro Trader’s Approach
Professional traders do not rely on the option chain or a technical chart alone to make trades. They also consider other factors such as
• Market news
• Market action
• Volume
• Futures
• Volatility
While the option chain shows you what is happening in the options market, it is always a good idea to supplement it with other tools when analyzing the market. Some other advanced concepts to learn include
1. Option writing
Option writers are often big players and their actions usually define support and resistance levels due to their sheer size. As such, it is always a good idea to keep an eye on the fresh option writing to know what large traders are up to.
2. Max Pain
Max pain is simply the strike price at which the maximum number of option contracts expire worthless. It acts as a guideline for some traders ahead of the expiry date. It must be noted, however, that it should not be used as a sole reference point when analyzing the market.
Using the example above, if Sensex is at 80,250, we can look at the option chain to find any unusual levels of put or call open interest.
StrikeCall OIPut OI80,200LargeSmall80,300Very LargeMedium80,400LargestLow
Based on the example above, you can assume that sellers are expecting a tough time moving the market beyond 80,400 given the very large call open interest at that level.
3. Look for changes in Open Interest (OI)
New traders often forget that open interest (OI) levels change constantly throughout the day. Markets are dynamic, and so are positions held by traders. If you see extremely large levels of call open interest at a certain strike price, you should always ask yourself, “is this strike price still popular among traders?”
It is always a good idea to analyze the option chain with changing open interest in mind. For example, look for the following patterns:
• Rising price + Rising call OI
• Falling price + Rising put OI
• Stable price + Falling OI
These are just a few examples. If you study the option chain more closely, you will certainly be able to find more interesting patterns.
4. Look for a balance between put and call options
A balanced options market has roughly the same level of put and call open interest as well as trading volume. A balanced market favors neither bulls nor bears so it makes sense to take your time when entering a trade.
On the other hand, an imbalance suggests favorable conditions for either bulls or bears depending on put or call options dominating the market.
5. Look at the implied volatility
High-implied volatility numbers tend to show up before major events such as
• RBI’s policy decision
• Elections
• Corporate results
• Key macroeconomic data releases
During periods of high volatility, options tend to be more expensive. With that said, don’t fall for the trap of chasing low implied volatility numbers hoping that prices will soon drop only for them to shoot right back up.
Putting it All Together – Using an Example
Let’s assume that the Sensex is trading at 80,100 points. The option chain looks like this.
StrikeCall OIPut OI80,000LowVery High80,100MediumHigh80,200HighMedium80,300Very HighLow
Based on the information above, here is what we can gather.
• Strong support around the 80,000 strike price
• Strong resistance around the 80,300 strike
• Sensex is likely to consolidate between 80,000-80,300
Now, keep in mind that this information does not guarantee what will happen next but it does tell you what most traders expect to happen.
Advanced Concepts and Pro Trader’s Approach
Professional traders do not rely on the option chain or a technical chart alone to make trades. They also consider other factors such as
• Market news
• Market action
• Volume
• Futures
• Volatility
While the option chain shows you what is happening in the options market, it is always a good idea to supplement it with other tools when analyzing the market. Some other advanced concepts to learn include
1. Option writing
Option writers are often big players and their actions usually define support and resistance levels due to their sheer size. As such, it is always a good idea to keep an eye on the fresh option writing to know what large traders are up to.
2. Max Pain
Max pain is simply the strike price at which the maximum number of option contracts expire worthless. It acts as a guideline for some traders ahead of the expiry date. It must be noted, however, that it should not be used as a sole reference point when analyzing the market.
PCR (Put Call Ratio)
Put Call ratio is the ratio between Put Open Interest and Call Open Interest. A high PCR indicates bullish markets, while a low PCR indicate bearish markets. Extreme PCR values sometimes hint at overcrowding in contracts which can lead to quick reversals.
Time decay
All options contracts have a decay value, called theta, associated with them which reduces as the expiry date approaches. In the last few days before expiry, this decay tends to accelerate, making time decay an important concept to understand and track. The real-world applications of the option chain include the following:
BSE Sensex Option Chain For Intraday Traders
Intraday traders usually look out for fresh OI, big jumps in IV (implied volatility), and sudden spikes in volumes as possible entry points.
BSE Sensex Option Chain For Swing Traders
Swing traders use the option chain to discover potential breakout levels, support-resistance levels, and changes in the general mood of the market over multiple days.
Hedging A Portfolio
Some investors utilise the put options of the BSE Sensex to hedge their diversified portfolios against market downturns, especially during volatile times.
Market Analysis
Market pundits analyse the option chain to garner an opinion on the market weightage and overall mood of the market ahead of important events like elections.
Common misconceptions about the BSE Sensex Option Chain
High OI Does not Always Mean A Reversal
One of the most common misconceptions about OI is that the maximum OI indicates a price reversal. In reality, markets often break through key levels with extremely high volumes, despite a high OI.
The option chain is not a market oracle
The option chain is often misunderstood to provide directional cues for trading, but it only represents the current positioning and expectation of the market. New information and events that unfold cannot be predicted using the OI data.
High Premiums do not mean high profits
High premium options have a lower risk-reward profile, making them less desirable for most retail traders.
Support and Resistance levels are not static
As open interest gets added or exited, important levels like support and resistance keep changing throughout the day. The following pointers can help retail traders utilise the power of the option chain more efficiently:
Traders can utilise the OI data along with price action to determine market direction.
Changes in Open Interest can be monitored to understand market positioning.
Implied volatility should be tracked ahead of crucial market-moving events.
Compare different expiry dates when taking long-term positions.
Monitor trading volumes to understand liquidity.
Position sizing is extremely important when trading options due to leveraged exposure.
Maintain a trading journal to evaluate how different levels in the option chain influenced your trading decisions.
BSE Sensex Option Chain Vs Nifty Option Chain
Option Chain FeatureBSE Sensex Option ChainNifty Option ChainUnderlying IndexSensexNifty 50ExchangeBSENSENumber of Stocks3050Market RepresentationLarge-cap companiesBroader large-cap marketLiquidityGrowingGenerally higherTrading PopularityIncreasing steadilyTraditionally higher
The BSE Sensex option chain and Nifty option chain are broadly similar in nature, though the BSE version is still catching up in terms of liquidity. Traders select one over the other depending on their individual preferences.
Frequently Asked Questions
What is the BSE Sensex option chain?
The BSE Sensex option chain provides a snapshot of all available call and put options for various strike prices in the BSE Sensex index. It includes information such as premiums, open interest, volume, and implied volatility.
Why is the option chain important?
It is crucial to understand the market weightage, support-resistance zones, liquidity, and prevailing positioning. The option chain provides valuable information to traders and investors.
Is the option chain easy to understand for beginners?
For beginners, getting familiar with the strike price, call and put options, premiums, and open interest is a great first step. As they gain confidence, they can explore more complex aspects of the option chain.
Can the Option Chain predict future prices?
No, the option chain is more of an indicator of market positioning rather than a predictor of future prices. While it provides valuable insights, it cannot be used as a definitive tool for forecasting.
What is Open Interest in the option chain?
Open interest represents the total number of open option contracts in the market. It is a useful metric for understanding market liquidity and participation.
How often is the option chain updated?
The option chain is typically updated in real time during trading hours to reflect the latest market data and price changes.
Are technical charts or option chains better for trading?
Both technical charts and option chains have their own strengths and weaknesses. Most experienced traders combine technical analysis with option chain analysis to get a more comprehensive view of the market.
Conclusion
The BSE Sensex option chain goes to beyond just being a listing of call and put options; it serves as a valuable snapshot of the market’s positioning and expectations. By thoroughly comprehending fundamental elements of this data, such as strike prices, option premiums, open interest, and volatility, traders can gain meaningful insights into the market’s potential movements while remaining mindful of the limitations of these indicators. To begin their journey, novice traders should first grasp the fundamental concepts related to the BSE Sensex option chain before delving into analysing its intricacies.
With time, they can combine their option chain analysis with technical analysis, price action, risk management, and broader market analysis to identify potential trading opportunities while exploring more trading insights. Ultimately, the option chain should be regarded as a decision-making guide rather than a definitive indicator of what will happen next in the markets. Used wisely, it can enable traders to make well-informed choices regarding their trades.